

Get Pluto - My free AI visibility chrome extension (Version 2.0)
NEW FEATURE UPDATE: Check all majors AI platforms for page visibility in one click.

Hi, I’m Aaron!
Thanks for checking out my AI Visibility Extension.
Yes, this extension is 100% free.
Download it here and add it to chrome.
I built this because I kept running into the same problem over and over: we talk a lot about SEO and rankings, but almost nobody talks clearly about how our content looks to AI systems. I wanted a simple way, right inside the browser, to see: “If an AI model or search engine reads this page, what does it actually see?”
This extension is my answer to that question.
FIRST, MY FAVORITE PART:
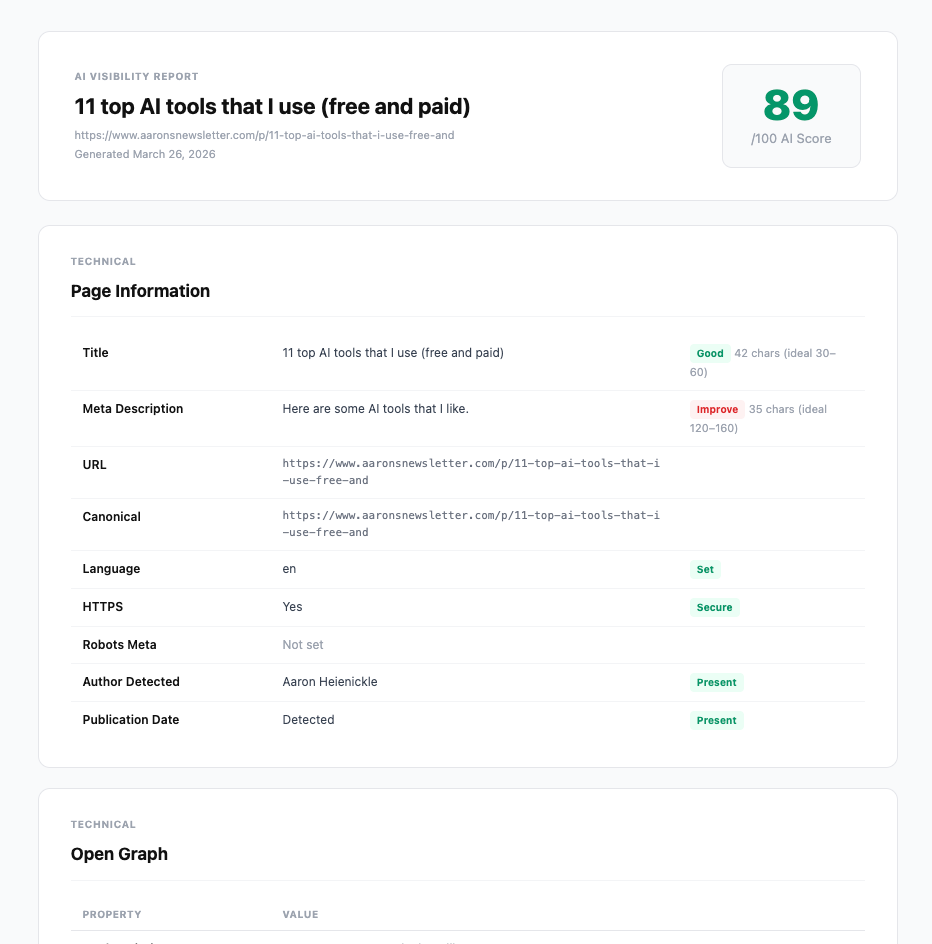
You can export everything — all of the data, all of the checks, all of the analysis — into a professional HTML report you can hand to a client or walk your team through in a meeting. It’s clean, it’s branded, and it took one click. That feels good.
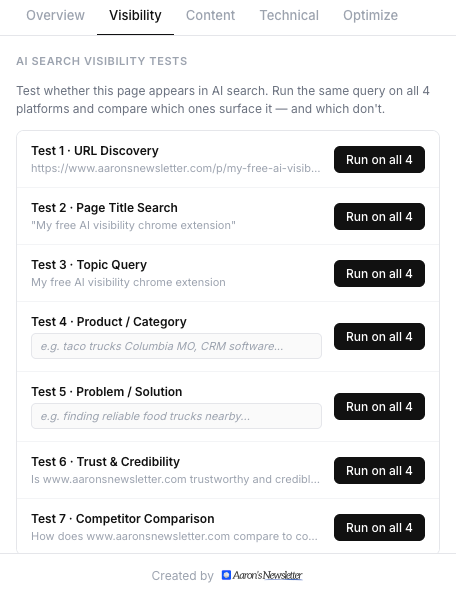
AI SEARCH VISIBILITY TESTS ( NEW )
This is what I’m most excited about. The extension runs 7 live visibility tests across all four major AI platforms simultaneously — Claude, ChatGPT, Grok, and Perplexity. Three tests are auto-generated from the page you’re on, two let you type in your own brand or topic queries, and two are generated from the domain itself. You get a direct look at whether your content is actually showing up in AI-generated answers — not just in theory, but right now, on those platforms.
AI VISIBILITY SCORE
I created the AI Visibility Score (0–100) because I wanted a single, honest number you can point to and say, “This page is getting there,” or “We’ve got work to do.” That score is a pulse check on how machine-readable, well-structured, and AI-friendly your content is. As AI-generated answers become more common, the pages that are easier for models to understand will be the ones that get surfaced, summarized, and recommended.
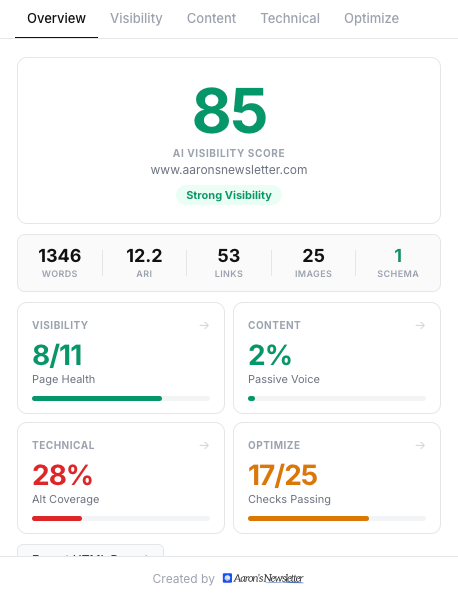
30 AI VISIBILITY CHECKS
The Optimize tab runs 30 individual checks covering schema, structure, content signals, metadata, authority markers, and technical signals. Failing checks show up first so you know exactly where to focus. Each check tells you what it found and why it matters for AI discoverability.
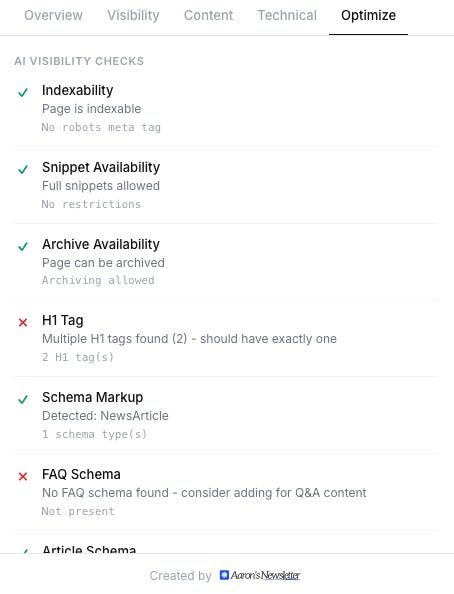
SCHEMA AND STRUCTURED DATA
I added schema and JSON-LD analysis because I kept seeing great content that wasn’t sending any clear signals to machines. Structured data is how you whisper directly into the ears of AI systems. You can instantly see every schema type found on the page, the full JSON, and where there are gaps — so your content can participate fully in rich results and AI-driven experiences.
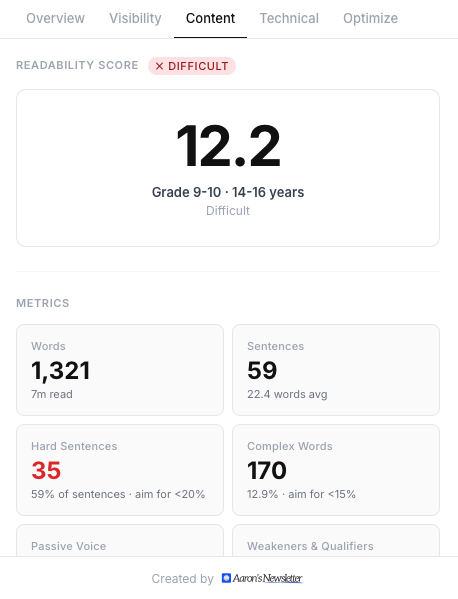
CONTENT READABILITY AND PASSIVE VOICE
I care a lot about clarity, so readability grading and passive voice detection were non-negotiable for me. The ARI score, passive voice bar, sentence-level metrics, and writing quality checks are all here because AI systems love content that’s straightforward, confident, and easy to summarize. I want you to see at a glance whether your writing is doing the work.
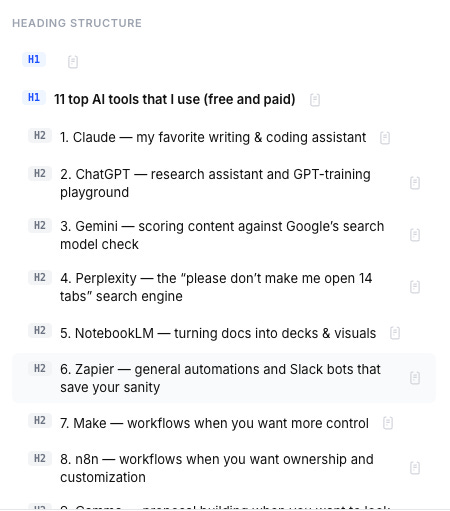
HEADING STRUCTURE AND CONTENT HIERARCHY
Messy headings quietly break both user experience and AI understanding. The heading structure view shows your full H1–H6 outline with a content tree map and word count distribution, so you can immediately see whether your page has a logical hierarchy or has buried its most important ideas.
LINKS AND ALT TEXT ANALYSIS
I built the links section and images section to match — clean horizontal bars, badge system (Internal, External, Nofollow for links; Has Alt, Missing for images), and full lists so you see every single URL and image on the page. Alt text is one of those details that’s easy to skip but incredibly powerful. Images carry meaning that AI models can’t use unless you describe them. I want to help you close that gap.
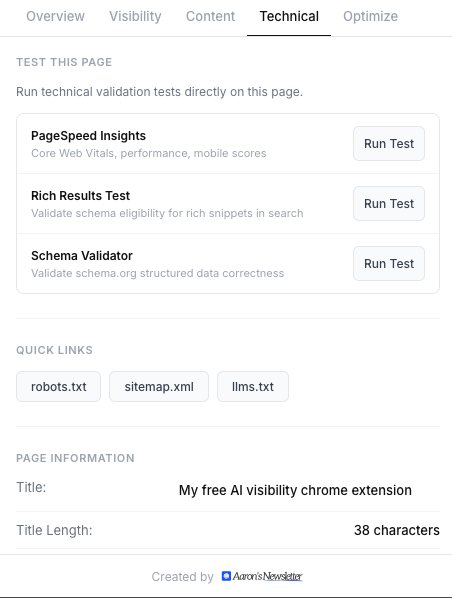
META, OPEN GRAPH, AND TECHNICAL SIGNALS
Titles, descriptions, canonical tags, robots meta, language declarations, HTTPS status, Open Graph, Twitter Cards — all of it is visible in one place. The Technical tab also includes one-click links to PageSpeed Insights, Rich Results Test, and the Schema Validator, so you can go from insight to deeper diagnostics in a couple of clicks. Quick links to your robots.txt, sitemap, and llms.txt are right there too.
REPORTING AND EXPORTS
I added HTML, JSON, CSV, and Claude Brief exports because I know what it’s like to be in a client meeting where everyone asks, “Can you send this over?” The HTML report is fully rebuilt — Mercury-style design, horizontal data bars, complete links list, complete images list with alt text, full schema JSON, and all 30 AI checks organized by pass and fail. One click and you have a professional deliverable, not just a screenshot.
PRIVACY AND LOCAL ANALYSIS
The extension runs entirely in your browser. No server calls, no external dependencies, no data leaving your machine. You can run it on staging environments, client sites, or internal pages without wondering where your data is going. The analysis is instant — it’s part of your everyday workflow, not a separate audit event.
The extension may collect an email address only when a user voluntarily subscribes to Aaron’s Newsletter. Email addresses are used solely to send newsletters and educational content about the future of search. Providing an email is optional and has nothing to do with using the extension. This is handled on aaronsnewsletter.com via Substack — not through the extension itself. Email addresses are never sold, rented, or shared with third parties
.
HELPING YOU STAY ONE STEP AHEAD
We’re moving into a world where content isn’t just written for search engines or human readers — it’s written for AI assistants, chatbots, and generative systems that decide what to surface and how to summarize it.
I built Aaron’s AI Visibility Extension to help you bridge that gap. I want to make sure your best ideas are actually visible in that future — not lost in messy structure, missing schema, invisible images, or content that AI can’t parse.
If you care about quality content, strong structure, and being ready for where AI and search are going next — I built this for you.
There is no reason not to try it. It’s free.